ASAP Workflow
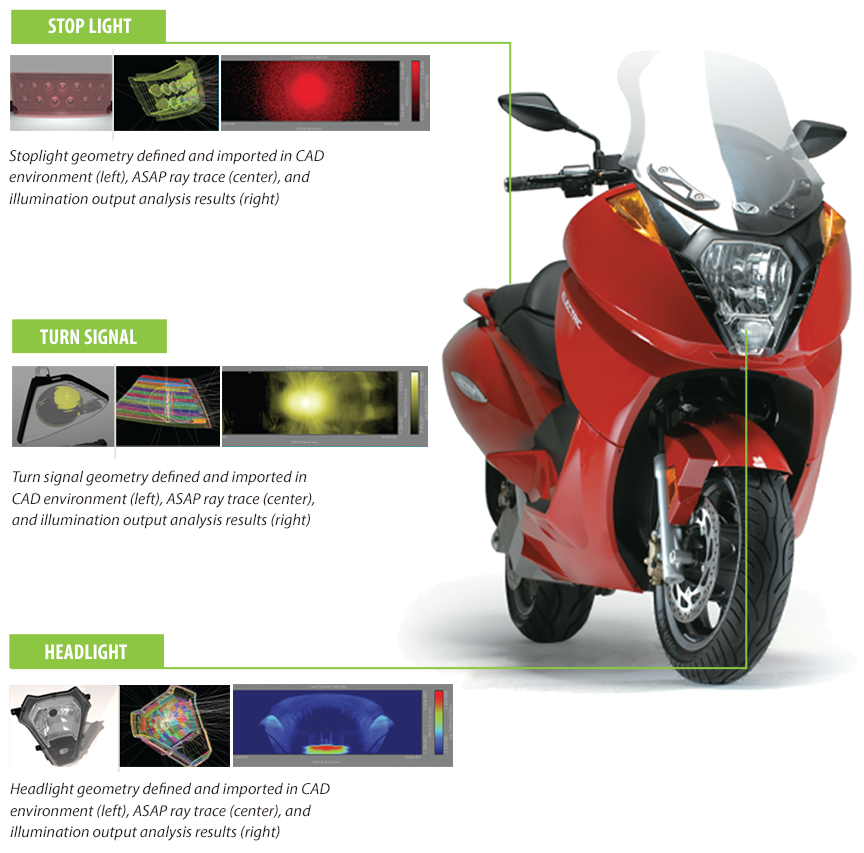
SPOTLIGHT // VECTRIX ELECTRIC SCOOTER: BRO Engineering Services used ASAP to design the headlight, stoplight, and turn signal illumination systems for the Vectrix all-electric scooter. ASAP accurately modeled the slope errors that result from reflector manufacturing processes, as well as scatter from roughness and imperfections in metallic coatings applied tothe reflectors. The Vectrix scooter is now in production and available for purchase.
Step 1: System Setup
Every optical system simulation begins with an accurate geometrical model. Import your system geometry from a CAD program in formats such as IGES, STEP, or XML, or use the proprietary BRO GTX file format to import from SolidWorks® 3D CAD software, which customers have the option to bundle with ASAP. During import, ASAP users may remove duplicateand unnecessary surfaces, as well as condition geometry for ray tracing. CATIA® users also have the option to open nativeCATIA files in ASAP. The powerful ASAP script language and spreadsheet-style Builder environments also provide manyoptions for modeling system geometry ranging from simple fixed-dimension surfaces to complex systems withdimensional parameterization, which allows geometrical entities to be treated as variables in system-optimization procedures.
Following geometrical system characterization, optical properties are defined to tell the analysis engine how to treatoptical interactions such as transmission, absorption, diffraction, polarization, and scattering. ASAP handles them all.Comprehensive material libraries accelerate system setup but when measurements for new materials must be used, theBRO Digitizer provides maximum flexibility for entering optical properties data and the BSDF fit utility allows fittingcomplex scatter models including the all-important Harvey scatter model. During system definition, 2D and 3Dvisualization tools ensure that everything is in place before the next step in the ASAP workflow.
Key System Setup Features
- Model systems using the ASAP Script language or Builder
- Use SolidWorks 3D CAD software with ASAP (license optional)
- Import geometry in IGES, STEP, or XML file formats
- Condition geometry and manage duplicates with SmartIGES™
- Import lenses from CODE V®, OSLO®, and ZEMAX®
- Model degree and state of polarization with MUELLER devices
- Use Liquid Crystal Cell and General Uniaxial Medium models
- Use Gaussian-beam decomposition for wavefront propagation
- Access source, lens, glass, scatter, and coating libraries
- Import data from images using the BRO Digitizer
- Model surface (BSDF) and volume scatter functions
- Visualize systems using flexible 2D and 3D plots
Step 2: Define Sources
Every system requires an accurate source model, and ASAP sources are the best in the industry. ASAP comes standard withhundreds of ready-to-use sources that save users hours.
Key Source Definition Features
- Source wizard and LED, CCFL, incandescent, and arc sources
- Use point sources, ray fans, grids and other ASAP sources
- Calculate and visualize extended-source illumination patterns
Step 3: Run Simulation
Once your system geometry, properties, and sources are defined, you’re ready to trace rays. With ASAP, you get the fastest non-sequential ray tracing engine available, as well as REMOTE™ for distributed processing — so you won’t be waiting long for results
Key Simulation Features
- Perform polychromatic ray traces
- Trace forwards, backwards, and stepwise in your system
- Trace rays to regions of importance within your system
- Verify polarization, scatter, and coherence at any surface
- Track individual rays and visualize ray traces as they occur
Step 4: Perform Analysis
When your ray trace finishes you’ll be ready to perform analysis, and the analysis features in ASAP are second to none. ASAP includes everything you need to evaluate your ideas, optimize your system, and visualize, interpret, and share results —taking into consideration the most complex of optical phenomena.
Key Analysis Features
- Use any of 600+ example files to begin your ASAP analysis
- Visualize results using 2D, 3D, Cartesian, polar, and other views
- Perform conformal radiometry and Path eXplorer™ analyses
- Optimize optical systems with single and multi-variable methods
- Perform numerical and graphical CIE/chromaticity analyses
- Visualize illumination characteristics and lit appearance of systems
- Visualize polarization using the Poincaré Sphere Visualization Tool
- Use Python, VBscript, Jscript, and other languages in your files
- Perform distributed processing on other machines with REMOTE